
Linq Zero Team Analytics
Linq Zero Team Analytics gives you a centralized view of how your team and phone numbers are performing over time. You can track conversation volume, response behavior, and line health so you can catch issues early and coach your team effectively.
Where to Find Team Analytics
-
Log in via browser to your Linq Zero dashboard at zero.linqapp.com.
-
In the left-hand navigation, click Team Analytics.
-
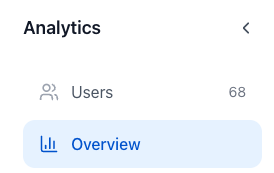
You’ll see two main sections:
-
Overview – org-wide metrics
-
Users – per-user / per-phone-number metrics
-
Overview Tab (Org-Wide View)
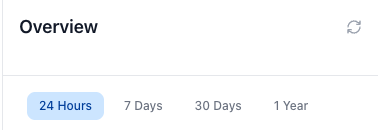
The Overview tab helps you understand conversation volume and responsiveness across your whole team.
At the top, you can choose a time range:
-
24 Hours
-
7 Days
-
30 Days
-
1 Year
Key Cards
-
New Conversations
Shows how many new conversations started in the selected time period. >50 per 24 hours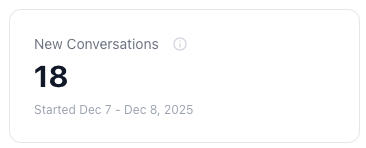
-
Responded Conversations
Shows how many of those conversations received at least one response from your team.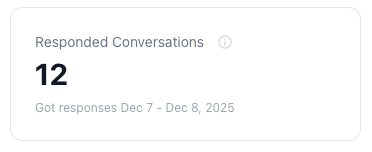
Use these two cards together to quickly see:
-
How many messages are sent out per day.
-
Response rates per messages sent.
Users Tab (Per-Number Analytics)
The Users tab lets you drill into each phone number’s performance.
Selecting a Phone Number
-
Click Users under Analytics.
-
In the middle column, you’ll see a list of phone numbers (and user names).
-
Select a phone number to open its detailed analytics on the right.
You can filter by time range at the top (24H, 7D, 30D, 1Y, or Custom).
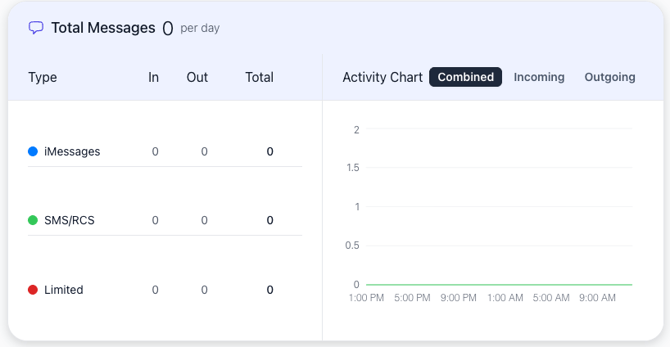
Total Messages
At the top of the detail view you’ll see:
-
Total Messages per day
-
Breakdown by Type:
-
iMessages
-
SMS/RCS
-
Limited (messages that hit restrictions/limits)
-
-
Activity Chart:
-
Views for Combined, Incoming, and Outgoing activity over time.
-
This helps you understand:
-
How busy a line is.
-
How much is inbound vs outbound.
-
Whether any “Limited” traffic is starting to creep up.
Line Health
Under Line Health, you’ll see widgets designed to tell you how “healthy” a phone line is.
Response Rate
-
Shows % of conversations responded to in the selected period.
-
Includes a small trend indicator (e.g., up or down vs previous period).
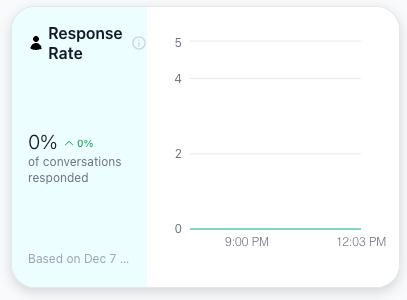
Use this to:
-
Identify users/lines that may be falling behind on replies.
-
Track improvement after training or process changes.
Volume Limit
-
Shows how many messages have been sent vs the configured Volume Limit.
-
Gives you a quick snapshot of how close a line is to its safe threshold.
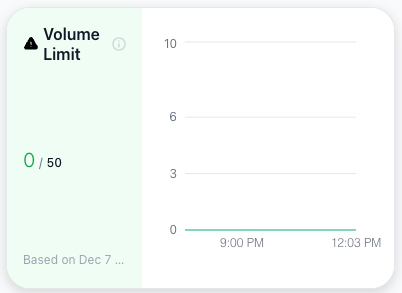
Use this to:
-
Avoid overuse that can lead to carrier/Apple risk.
-
Decide when to add additional lines for high-volume teams.
Conversation Quality
At the bottom of the analytics view you’ll see Conversation Quality cards:
-
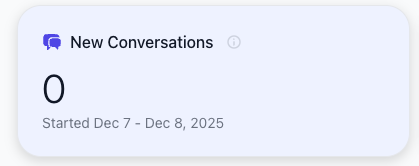
New Conversations – how many conversations started during the period.
-
Responded Conversations – how many of those conversations got a reply.
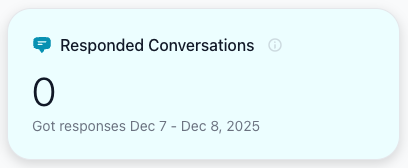
These mirror the org-wide metrics but for the selected phone number, helping you identify which users/lines are doing the most work and whether they’re keeping up.
Currently not available on mobile app