Linq x GoHighLevel: Using Phone Analytics
Overview
The Phone Analytics pages in GoHighLevel (GHL) show how each of your Linq numbers is being used and how healthy they are over time.
With Phone Analytics you can quickly see:
-
Are people actually replying to your messages?
-
How much traffic is iMessage vs SMS/RCS?
-
Is any line at risk of being limited or flagged?
-
How many new conversations you’re starting vs how many are responding?
How to Open Phone Analytics in GoHighLevel
-
Log into your GoHighLevel account.
-
In the left sidebar, click Linq (under the settings/gear area).
-
At the bottom left, click Settings (green pill icon).
-
Along the top of the Settings page, select the Phone Analytics tab.
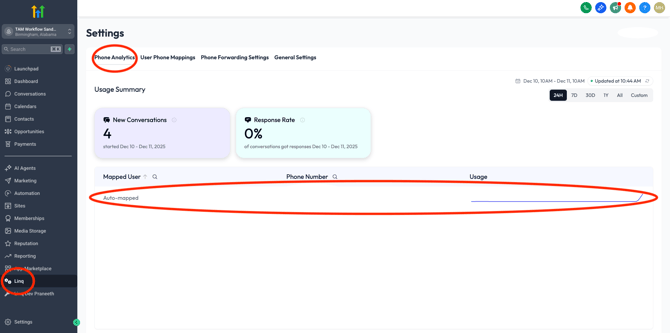
You’ll now see the Phone Analytics Overview page for all Linq numbers in this GHL sub-account.
Phone Analytics Overview (All Numbers)
The Overview page gives you a high-level summary of all Linq numbers connected to this sub-account.
1. Usage Summary Cards
At the top you’ll see cards such as:
New Conversations

-
Shows how many brand-new conversations started in the selected time range (24H, 7D, 30D, 1Y, Custom).
-
A “new conversation” is typically an outbound message that starts a fresh thread with a contact.
-
Use this to understand outreach volume and how active your lines are.
Response Rate
-
Shows the percentage of conversations that received at least one reply from the contact.
-
This is your engagement health metric.
As a general guide:
-
✅ Healthy: 30–40%+
-
⚠️ Watch: 15–30%
-
🚨 Risky: under 15% (higher chance of deliverability issues or lines being limited)
You can change the time window using the date picker (top-right of the page).
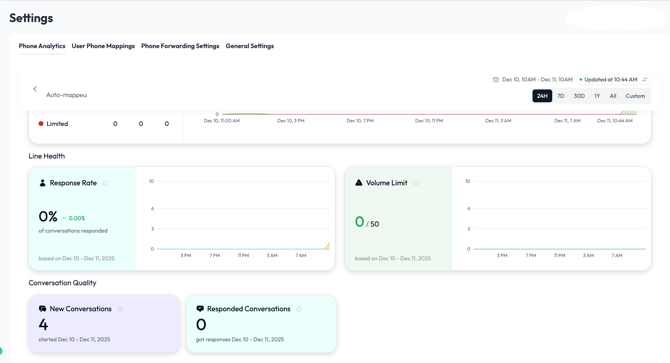
Per-Line Analytics Detail
When you click into a phone number, you’ll see a detailed analytics page for that specific line.
This view is broken into three main areas:
-
Activity Overview (7-day period)
-
Line Health

-
Conversation Quality
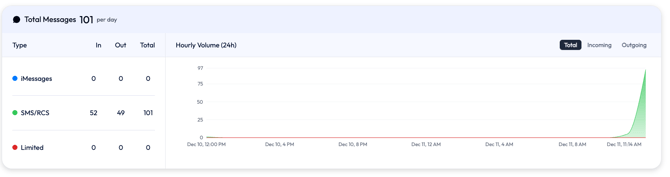
1. Activity Overview
This section shows how much traffic is flowing through that line and what type it is.
You’ll typically see:
Total Messages (per day)
-
Total incoming + outgoing messages over the time range, normalized per day.
-
Use this to see if volume is increasing, steady, or dropping.
Type Breakdown Table
A table with columns like:
-
Type
-
iMessages – Apple iMessage traffic
-
SMS/RCS – standard carrier traffic
-
Limited – messages that were constrained due to safety/risk rules (this should usually be 0)
-
-
In – messages from the contact to your line
-
Out – messages from your line to the contact
-
Total – In + Out
Keep an eye on the Limited row. If it’s not zero, that’s a sign the system is protecting the line due to risk.
Hourly Volume (24H) Chart
-
A chart showing when messages were sent.
-
You can usually toggle between Total, Incoming, and Outgoing.
Use it to:
-
Confirm when campaigns are actually sending
-
See what times of day contacts are most responsive
-
Spot unusual patterns (e.g., large spikes at off-hours)
2. Line Health
The Line Health section focuses on metrics that indicate whether a line is “safe” and performing well.
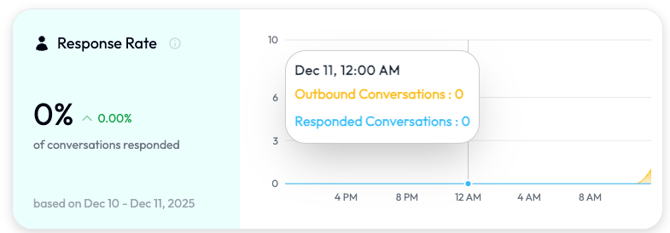
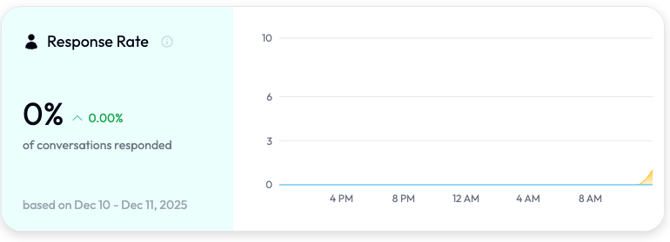
Response Rate (per line)
-
Same metric as the Overview page, but only for this single number.
-
Shows the trend of what % of conversations receive a reply.
Use it to:
-
See if changes to messaging are improving engagement
-
Spot lines where prospects rarely respond
-
Track engagement over time (per campaign or per rep)
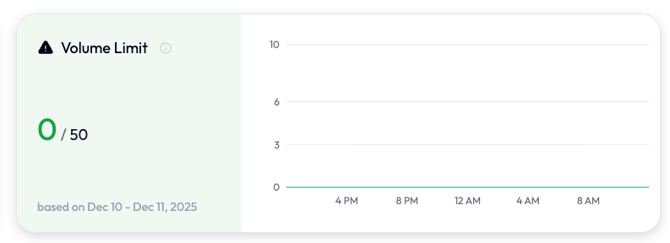
Volume Limit
-
Shows how many Response Limited messages have been used
-
Once the line hits its daily limit, new outbound conversations may slow down or stop until the limit resets.
Use it to:
-
Pace new outreach so you don’t max out a line early in the day
-
Diagnose “Why aren’t new outbound messages going out?” → Check if the line hit its limit
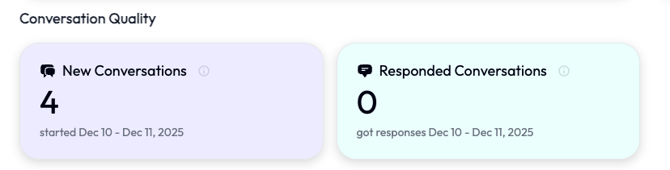
3. Conversation Quality
The Conversation Quality section gives you counts that sit behind the Response Rate:
-
New Conversations – How many brand-new threads started in the selected time range.
-
Responded Conversations – How many conversations had at least one reply from the contact.
How to read them together:
-
High New Conversations + Low Responded Conversations
→ You’re reaching out, but people aren’t engaging. Time to adjust copy, targeting, or timing. -
Balanced New vs Responded
→ Healthy: you’re starting conversations and getting meaningful replies. -
Low New + Low Responded
→ The line may not be used much right now.